 visuals + editorial graphics
Our first news apps: Tracking weather and elections
We’ve been working together as a team for about four months now, with most of our projects focused on the presidential campaign and this month’s elections. Here’s a rundown of some of our favorites:
Wildfires
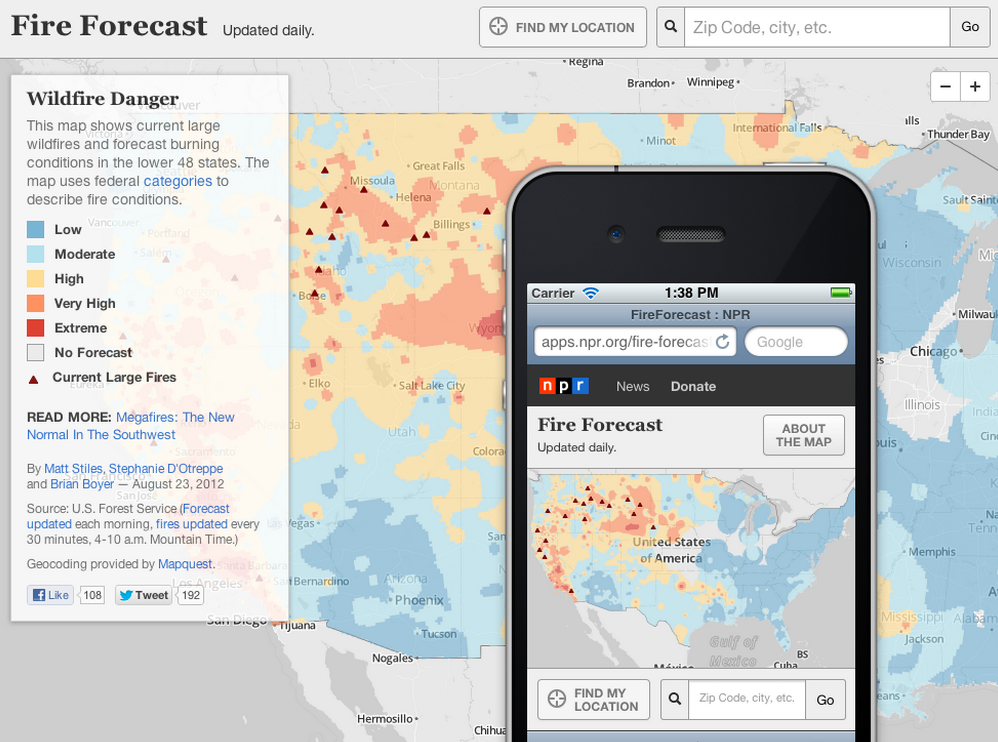
Fire Forecast began as a complement to a series of radio stories about the recent severe wildfires. The project started as a more traditional visualization using the many, many sources of government data – when and where fires occurred, how large they grew, and how much they destroyed.
But it morphed into something more useful: a localizable map showing the government’s daily forecast of fire danger and the location of large fires.
The app is responsive to various screen sizes, and functions nicely on (most) mobile devices. On the iPhone, there’s even a handy tool tip that allows users to bookmark the app to their home screens.
Drought

This map morphed from an interactive built by the NPR StateImpact team focusing on the historic Texas drought of 2011:
Texas experienced its worst drought on record last year. Now that the state is seeing some relief, drought conditions have consumed more than half the United States. Use this interactive map and chart to see how conditions have changed over time.
When the drought reached historic levels across the country, we used similar code and national data to expand the chart and extend the map.
It has a play button so users can see the dry conditions expand across the country over time. The chart allows users to see the ground area covered by drought over the years.
Early voting
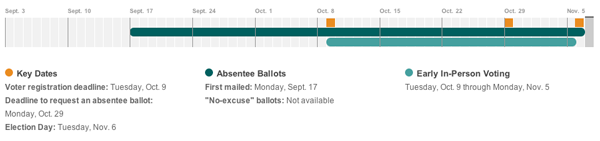
When the early voting periods drew closer, our elections team wanted a list of states and their rules. What resulted was a responsive page that gave readers information about key deadlines in their respective dates for registration and early or absentee voting, among other useful bits of information.
These calendars give the list visual elements and make the key date ranges more digestible:
Conventions/Debates
We covered the Democratic and Republican party conventions with an app template originally dubbed ‘Frankenstein’. It had a responsive layout and the now familiar simple footer/header design in our current app template, which is open source.
The apps featured audio of the key floor speeches and NPR’s live coverage. They both also had a moderated chat with our journalists and politics experts fielding audience questions. And we linked to our live blog posts and related stories.
We used a similar feature for the presidential debates, but we added the “back channel,” a curated social media stream, to the page.
Elections
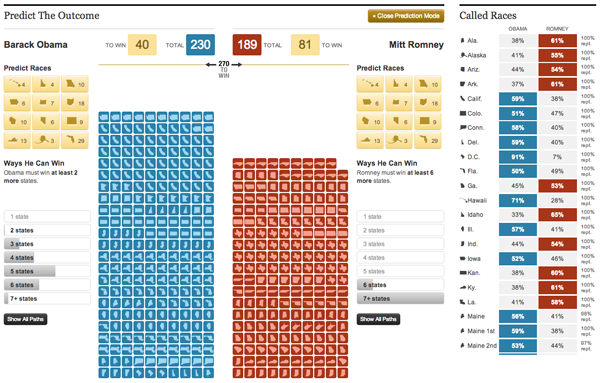
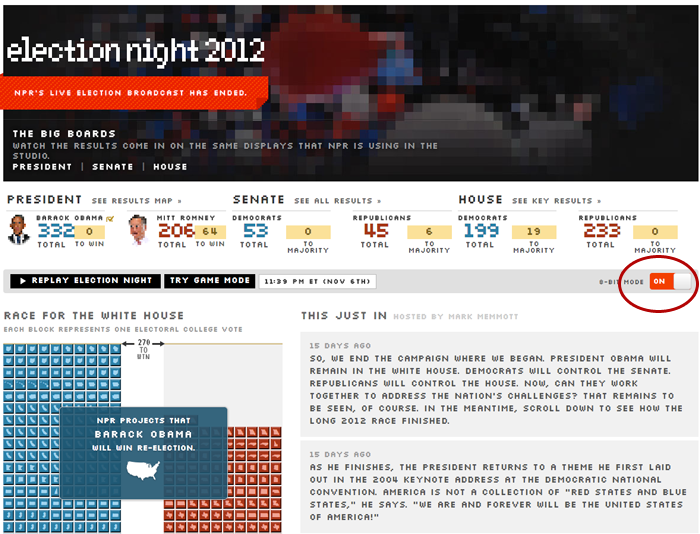
For our elections coverage, we tried something different. Rather than an results map, we used small colored blocks and StateFace to visualize the Electoral College in real time. (Brian was inspired by Tetris). As states were called for either presidential candidate, their respective blocks would fall into place.
The Election Night version of the app, which is also open source, was an extension of our Swing State Scorecard, which allowed users to game out the presidential candidates’ potential paths to victory.
On Election Night, we relied on the Associated Press for the traditional red-state, blue-state map, and also used its data for U.S. House and U.S. Senate results pages (and the topline results on the main page).
We also used the data for our internal Big Boards, the screens our hosts used during the night’s broadcast to track the results. We decided to make them actually public late in the process:
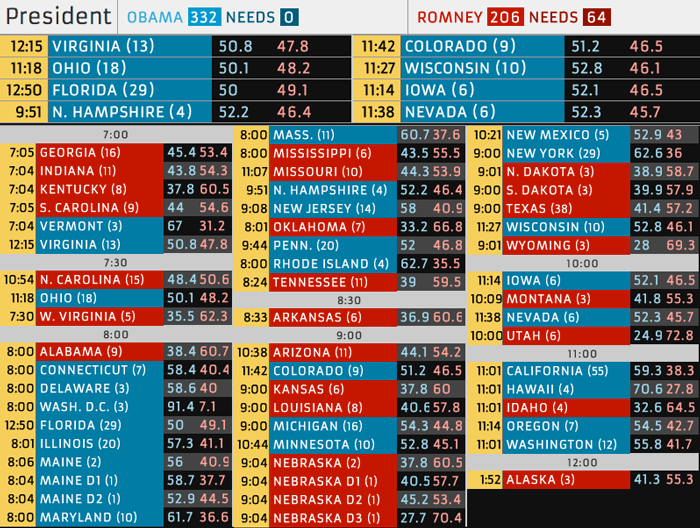
Check out the U.S. House and U.S. Senate boards, too.
The app is still live, and now allows users to replay the presidential election and watch the blocks and winner alerts. NPR called the race for President Obama around 11:20 p.m.
Don’t for to check out the app in 8-bit mode, graciously created by Tyler Fisher and Jeremy Gilbert.