Self-hosted slippy maps, for novices (like me)

In May, we published a story diving into the nuances of the USDA plant hardiness zone map, which was updated in 2023 for the first time in a decade. I am a gardener AND a map nerd, so this was the juiciest, data-rich gardening story I was ever going to see. So we built an immersive story explaining what changed across the country, and what it means for our readers’ gardens.
It honestly feels like a Stefon meme. This app has EVERYTHING:
- Walking azaleas
- Rainbow D3.js charts
- “Mad Libs”-style, dynamic text for 30k+ places
- Naked figs in a freezer
- A color ramp with 26 unique colors
And of particular interest to this blog post:
- Self-hosted slippy maps
Slippy maps, which I’m defining here as pan-and-zoomable vector tile maps, can be quite costly to host with a third party like Mapbox. Historically, self-hosting was possible, but required a lot of technical expertise. But over the past two years, Kevin Schaul (Washington Post), Chris Amico (MuckRock) and others have outlined new approaches that lower the technical bar to self-hosting maps — and cost significantly less.
Here’s what we learned:
Skip building your own OSM layer. Use Protomaps’ daily download instead.
The tools that Schaul outlined fit together something like this:
Workflow with OpenMapTiles
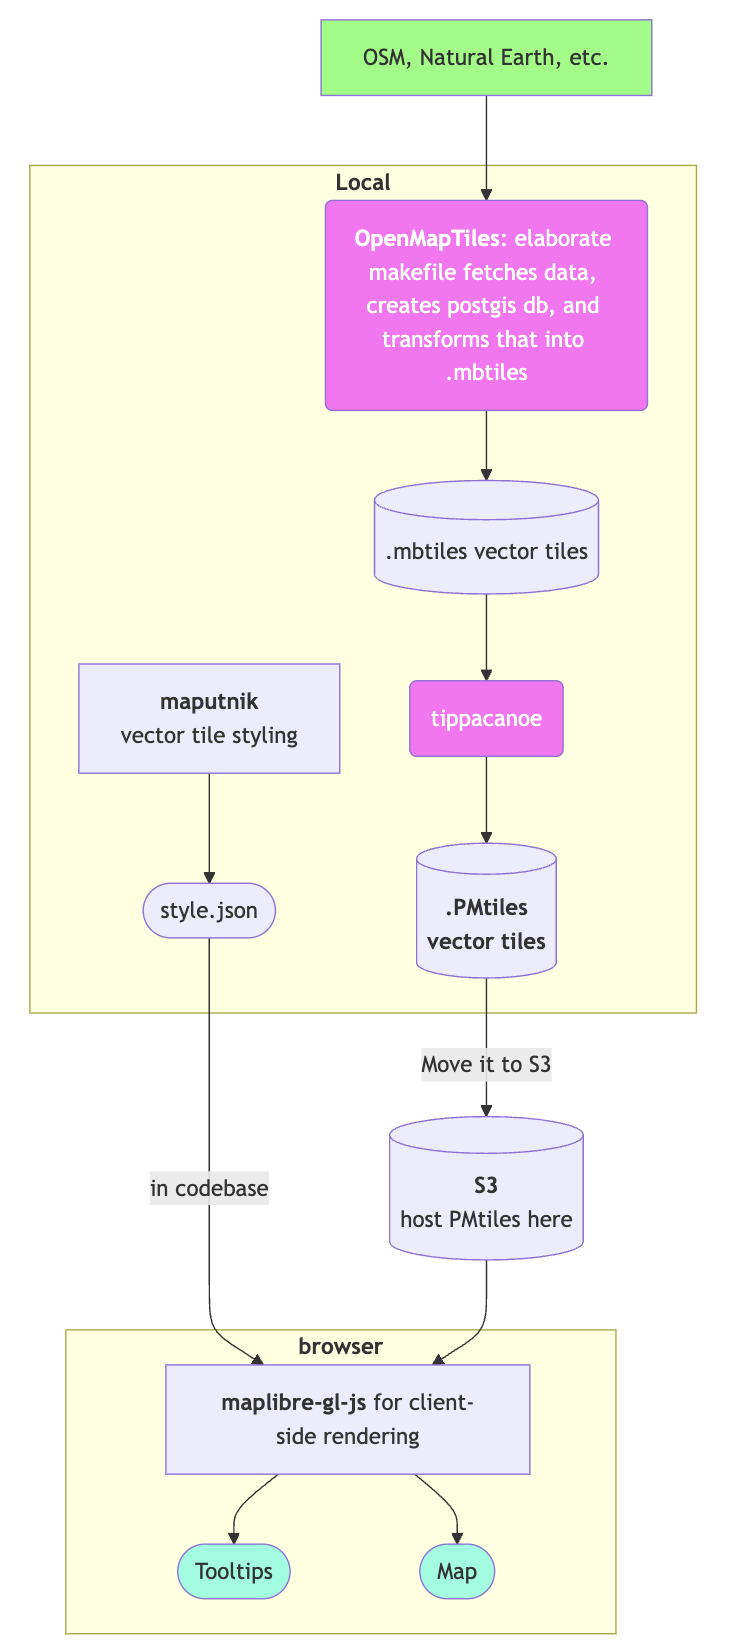
It starts by baking your own OpenStreetMap and Natural Earth-based vector tiles via OpenMapTiles’ command line interface. I dove into it, but got totally overwhelmed. Confession time: I have never used Docker before, and I avoid PostGIS like the plague. I only recently learned what a makefile is. And that’s like…the whole thing.
[If you do want to go this route, I suggest following this workshop (videos 1, 2, 3, 4) to understand the ecosystem. They also have an easier-to-use paid tier.]
Thankfully, Amico’s blog post and talk at NICAR 2024 pointed out a pathway to avoid this step: use the Protomaps weekly PMTiles world build.
Protomaps is a fully free and open-source web mapping ecosystem spearheaded by developer Brandon Liu. It includes (as described on their website):
- PMTiles, an open archive format for pyramids of tile data, accessible via HTTP range requests.
- An ecosystem of tools and libraries for creating, serving and manipulating PMTiles.
- A cartographic “basemap” showing features in the world like roads, water bodies and labels, based on the OpenStreetMap dataset, and delivered as one big PMTiles archive.
And the trick here is that Protomaps provides a copy of the whole world, downloadable for free. (See an example basemap using this data.) This contains all the data that would be available if I rolled my own tileset with OpenMapTiles, but without needing to wade into Docker and understand what a “schema” is.
Each build is about 120 GB. Assuming you have somewhere local to store that data, you can trim it to your desired area using Tippecanoe. You can also extract a specific area of your liking instead of downloading the whole world.
This simplified our workflow to the following:
Workflow with
OpenMapTiles

Workflow with
Protomaps weekly builds
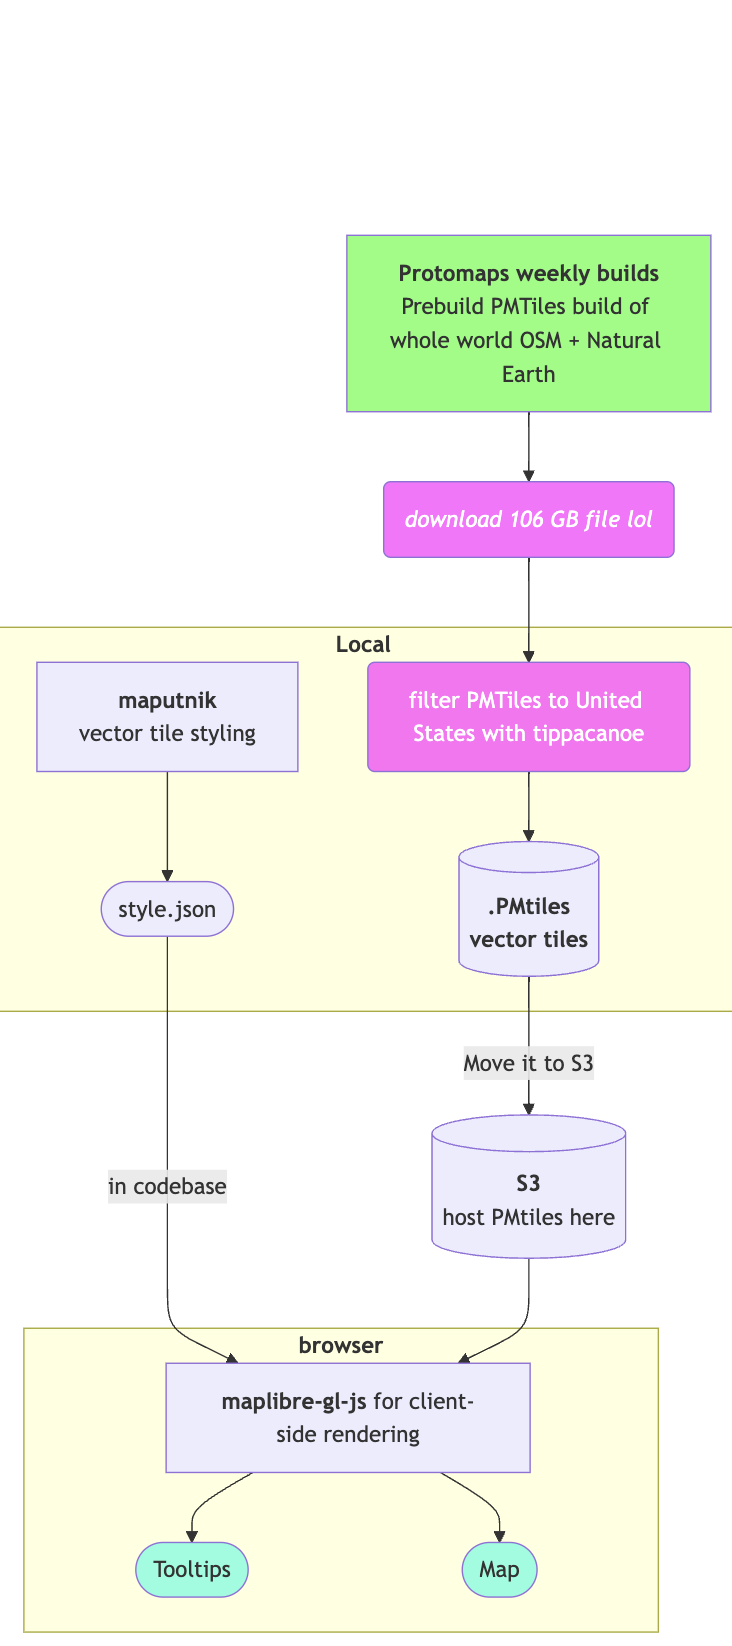
Trimming the tiles by bounding box was fairly easy, and allowed us to store less than the whole world. But trimming data based on country was not easy to figure out. That’s why some Mexican and Canadian cities are in our basemap. This isn’t ideal, but it was expedient. If we really needed to trim these things out, I think we’d have to use something like OpenTileMaps, which would have given us more fine-tuned control over what data goes into the basemap. (But if you know a better way, please let me know!)
It really IS a lot cheaper.
Self-hosting maps, beyond being daunting, used to cost a lot more than it does now. Before the PMTiles filetype existed, hosting vector tiles required either a server-side component (a “tile server”) or pre-baking every tile at every zoom level — and uploading and hosting all those individual tiles.
But with PMTiles you do not need to run a server to host and deliver vector tiles. Instead, you only need to drop the big PMTiles file somewhere accessible (S3 for instance, and ideally behind a CDN like Cloudfront). And Protomaps relies on the magic of HTTP range requests, where users only request the small portion of the PMTiles file that they need at any given time. The result: You can self-host maps at a substantial savings.
Protomaps provides a handy cost calculator to estimate a project’s costs versus other hosted options. I adapted this for my own calculator in Google Sheets .
Here are some topline things we learned:
The real cost is transfer from S3 to the browser
(Caveat: All these estimates are based on prices and polices at the time of publishing.)
- About 90% of the costs are for bandwidth from Cloudfront (Amazon’s CDN) to the internet. This is the total data transferred to users, and it costs about a dime for every gigabyte transferred. (And remember, users aren’t downloading the whole giant PMTiles file — just a tiny range of it.) OSM and hillshade tiles each averaged about 100 KB per tile. Our custom tiles for garden zones were much smaller. Transferring the data for about 100,000 tiles would cost $1.
- About 8% of the costs are based on the total number of GET requests made by users. Each tile requested is one GET request. Each PMTiles file shows about 4 tiles per zoom level per layer displayed. 100,000 GET requests would cost about 9 cents.
- A hypothetical scenario: If your project requests 100 tiles in an average session, and it gets 1,000 pageviews, that totals 100,000 tile requests. If your project gets 1 million pageviews in a month, your estimated costs for that month would be around $1,100. (For most news projects, the highest traffic — and costs — would come during that first month, and then trail off in subsequent months.)
It’s hard to say precisely how well the estimates matched up with reality, but they seemed to be in the ballpark.
To compare, that’s about ⅓ the cost that similar traffic might cost with a hosted service.
Don’t fret about the large size of the world map.
Storage on S3 is extremely cheap, about 0.1% of all costs for this project. Storing the WHOLE WORLD (~120GB) only costs about $3 per month. Functionally, this means storage volume is not a concern. Data transfer into S3 is also free, so there are almost no costs associated with getting huge files onto S3.
Most requests to get data out of S3, including PUT requests, do cost a tiny amount ($0.005 per request) — this is why the older strategy of generating static tiles can be an expensive proposition.
How to save money (and speed up loading!)
The main two axes to save money are:
- reduce the total number of tiles requested, and
- reduce the size of each tile.
Here’s how we approached this:
- Hide layers at certain zooms. For instance, we opted to avoid showing the hillshade layer until the map was zoomed in. This reduced the number of large tiles requested.
- Lazy-load tile layers. Initially the show/hide logic was based on the opacity of layers. This requested 3-4 more tiles than needed to be shown at any given time, which was costly and inefficient. Changing this logic dramatically improved the browser’s paint speed and saved us money.
- Cap maximum zoom level in explore mode. At a certain point, the user doesn’t need to zoom any further, so limit it to save on the number of tile requests.
- Limit exploration if it’s not essential. We really wanted to have folks be able to find themselves in the data and explore it. Sometimes this is not necessary. Limiting exploration can confine the upper end of possible costs.
Use ChatGPT (or similar) to help you understand inscrutable documentation
The Mapbox/Maplibre GL JS style spec is inscrutable:
map.setPaintProperty('2023_zones','fill-opacity',['interpolate',['linear'],['zoom'],0, 1, 7, 1, 8, 0.78, 22, 0.78 ]);
ChatGPT at least pretended to understand it perfectly. When asked what this code is doing, it explained it line by line, ending with:
“In summary, the fill opacity for the 2023_zones layer starts fully opaque at lower zoom levels (0-7) and becomes slightly more transparent (0.78 opacity) at zoom level 8 and remains at that opacity for higher zoom levels.”
Helpful!
But beware: It can also lie! For instance, I asked “Is there a way in Maplibre GL JS style to adjust the opacity only on the fill-outline property?” The correct answer is no, as far as I can tell. But ever the people pleaser, ChatGPT confidently told me:

The only problem is that transparentize does not exist in either style spec. It exists in Sass and maybe elsewhere, but not here. I figured this out with some quick Googling, but similar stochastic parroting can lead to some weird wrong turns. Buyer beware. (It’s worth noting that this hallucination took place on GPT-3.5. When I recently asked the same question to GPT-4o, it provided a more reliable answer.)
Important notes for styling your basemap
Finally, I want to share a few tools that are helpful in making your wildest self-hosted map dreams come true.
Styling your own basemap in the Maplibre GL JS style without a graphical user interface (GUI) is next to impossible. Luckily, you can use the Maputnik GUI to edit styles. (I found it much easier to use online, but there is a version you can run locally.)
If you’re using tiles generated from the Protomaps weekly builds the easiest starting point is the Protomaps Light style, available in Maputnik. Open the editor, click “Open”, then scroll down and click on “Protomaps Light”. Edit the map styles to your liking in Maputnik, then export the style.json to your project. I recommend committing this file to your project so that you have a version history of your style as it changes.
(Note: If you start with a style like OSM Liberty, and try to connect it to a Protomaps tileset, you will have to tweak layer names in style.json to match Protomaps’ basemap schema. For instance, your source layer name for country boundaries will need to change from “boundary” to “boundaries”. These sorts of things are devilishly difficult to identify!)
To add your preferred fonts to the style.json, you will need to create the appropriate .pbf files for each zoom level and style. The MapLibre font maker makes this a cinch. Store the generated .pbf files on S3 and reference that location in your style.json.
Similarly, you may need to make a custom sprite sheet. A sprite sheet is a single png that contains all icons and symbols that you might see on a map. A json key tells the mapping software what section of the sprite sheet to slice and use for the desired symbol.
In our case, we didn’t really have any conventional icons that were needed. But in order to avoid including a large legend on every map page, and for accessibility reasons, we wanted to include a layer that would show the hardiness zone names repeated across the map.
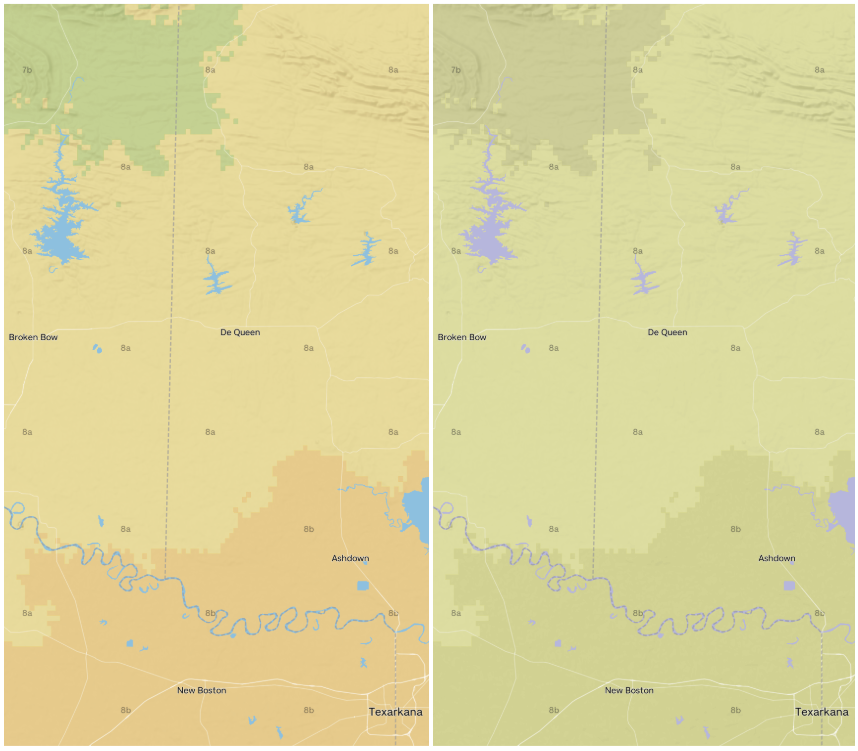
Left, the map in full color. Right, the map as it may look to someone with deuteranopia color blindness. In this view, you can see how the repeated zone labels would help readers distinguish between zones 7b and 8b.
There are a few solutions out there to create custom sprite sheets; I found that Spreet worked like a charm.
Great strides, but there are other costs to consider
The recent advances in self-hosted web maps are really exciting, but it’s important to remember a few caveats:
Hosting maps with a commercial provider like Mapbox comes with a raft of support and a more polished toolset. While the community around self-hosted solutions is robust and often available to help, there is no dedicated support if you go this direction.
Learning new tech is time-consuming and daunting. If you feel overwhelmed, look me up on the internet or in the #maps channel of the News Nerdery Slack group and ask for help! Also, I recently presented on this topic at the NACIS conference in October (as did Protomaps’ Liu).
Good luck!
 visuals + editorial graphics