 visuals + editorial graphics
Simplifying map production

When news happens in locations that our audience may not know very well, a map seems like a natural thing to include as part of our coverage.
But good maps take time.*
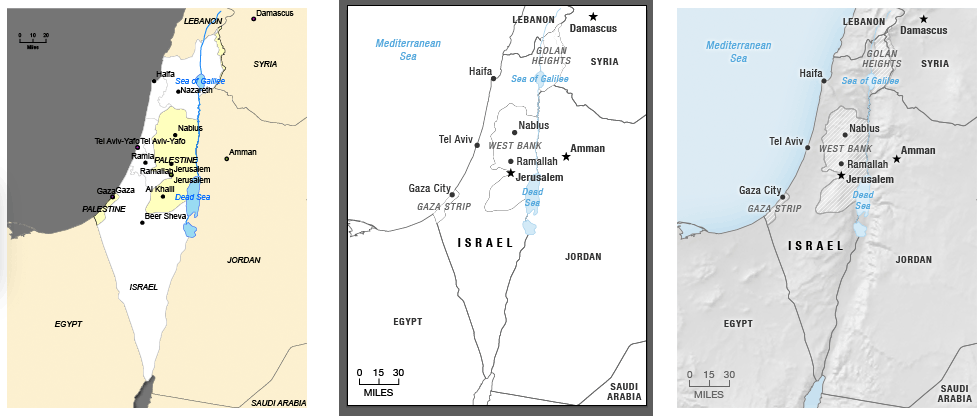
In ArcMap, I’ll assemble the skeleton of my map with shapefiles from Natural Earth and other sources and find an appropriate projection. Then I’ll export it to .AI format and bring it into Adobe Illustrator for styling. (In the example below, I also separately exported a raster layer for shaded relief.) And then I’ll port the final thing, layer by layer, to Adobe Photoshop, applying layer effects and sharpening straight lines as necessary.
(* Note: I enjoy making maps, but I am unqualified to call myself a cartographer. I owe much, though, to the influence of cartographer colleagues and GIS professors.)
I concede that this workflow has some definite drawbacks:
-
It’s cumbersome and undocumented (my own fault), and it’s difficult to train others how to do it.
-
It relies on an expensive piece of software that we have on a single PC. (I know there are free options out there like QGIS, but I find QGIS’s editing interface difficult to use and SVG export frustrating. ArcMap has its own challenges, but I’m used to its quirks and the .AI export preserves layers better.)
-
This reliance on ArcMap means we can’t easily make maps from scratch if we’re not in the office.
-
The final maps are flat images, which means that text doesn’t always scale readably between desktop and mobile.
-
Nothing’s in version control.
So for the most recent round of Serendipity Day at NPR (an internal hackday), I resolved to explore ways to improve the process for at least very simple locator maps – and maybe bypass the expensive software altogether.
Filtering And Converting Geodata
My colleague Danny DeBelius had explored a little bit of scripted mapmaking with his animated map of ISIS-claimed territory. And Mike Bostock has a great tutorial for making maps using ogr2ogr, TopoJSON and D3.
(ogr2ogr is a utility bundled with GDAL that converts between geo formats. In this case, we’re using it to convert GIS shapefiles and CSVs with latitude/longitude to GeoJSON format. TopoJSON is a utility that compresses GeoJSON.)
Danny figured out how to use ogr2ogr to clip a shapefile to a defined bounding box. This way, we only have shapes relevant to the map we’re making, keeping filesize down.
ogr2ogr -f GeoJSON -clipsrc 77.25 24.28 91.45 31.5 data/nepal-geo.json ../_basemaps/cultural/ne_10m_admin_0_countries_v3.1/ne_10m_admin_0_countries.shp
We applied that to a variety of shapefile layers — populated places, rivers, roads, etc. – and then ran a separate command to compile and compress them into TopoJSON format.
ogr2ogr -f GeoJSON -clipsrc 77.25 24.28 91.45 31.5 data/nepal-geo.json ../_basemaps/cultural/ne_10m_admin_0_countries_v3.1/ne_10m_admin_0_countries.shp

ogr2ogr -f GeoJSON -clipsrc 77.25 24.28 91.45 31.5 data/nepal-cities.json -where "adm0name = 'Nepal' AND scalerank < 8" ../_basemaps/cultural/ne_10m_populated_places_simple_v3.0/ne_10m_populated_places_simple.shp

ogr2ogr -f GeoJSON -clipsrc 77.25 24.28 91.45 31.5 data/nepal-neighbors.json -where "adm0name != 'Nepal' AND scalerank <= 2" ../_basemaps/cultural/ne_10m_populated_places_simple_v3.0/ne_10m_populated_places_simple.shp

ogr2ogr -f GeoJSON -where "featurecla = 'River' AND scalerank < 8" -clipsrc 77.25 24.28 91.45 31.5 data/nepal-rivers.json ../_basemaps/physical/ne_10m_rivers_lake_centerlines_v3.1/ne_10m_rivers_lake_centerlines.shp

ogr2ogr -f GeoJSON -clipsrc 77.25 24.28 91.45 31.5 data/nepal-lakes.json ../_basemaps/physical/ne_10m_lakes_v3.0/ne_10m_lakes.shp

ogr2ogr -f GeoJSON -clipsrc 77.25 24.28 91.45 31.5 data/nepal-roads.json ../_basemaps/cultural/ne_10m_roads_v3.0/ne_10m_roads.shp

topojson -o data/nepal-topo.json --id-property NAME -p featurecla,city=name,country=NAME -- data/nepal-geo.json data/nepal-cities.json data/nepal-neighbors.json data/nepal-rivers.json data/nepal-lakes.json data/nepal-roads.json data/nepal-quakes.csv
(Why two separate calls for city data? The Natural Earth shapefile for populated places has a column called scalerank, which ranks cities by importance or size. Since our example was a map of Nepal, I wanted to show a range of cities inside Nepal, but only major cities outside.)
Mapturner
Christopher Groskopf and Tyler Fisher extended that series of ogr2ogr and TopoJSON commands to a new command-line utility: mapturner.
Mapturner takes in a YAML configuration file, processes the data and saves out a compressed TopoJSON file. Users can specify settings for each data layer, including data columns to preserve and attributes to query. The config file for our Nepal example looked like this:
bbox: '77.25 24.28 91.45 31.5'
layers:
    countries:
        type: 'shp'
        path: 'http://www.naturalearthdata.com/http//www.naturalearthdata.com/download/10m/cultural/ne_10m_admin_0_countries.zip'
        id-property: 'NAME'
        properties:
            - 'country=NAME'
    cities:
        type: 'shp'
        path: 'http://www.naturalearthdata.com/http//www.naturalearthdata.com/download/10m/cultural/ne_10m_populated_places_simple.zip'
        id-property: 'name'
        properties:
            - 'featurecla'
            - 'city=name'
            - 'scalerank'
        where: adm0name = 'Nepal' AND scalerank < 8
    neighbors:
        type: 'shp'
        path: 'http://www.naturalearthdata.com/http//www.naturalearthdata.com/download/10m/cultural/ne_10m_populated_places_simple.zip'
        id-property: 'name'
        properties:
            - 'featurecla'
            - 'city=name'
            - 'scalerank'
        where: adm0name != 'Nepal' AND scalerank <= 2
    lakes:
        type: 'shp'
        path: 'http://www.naturalearthdata.com/http//www.naturalearthdata.com/download/10m/physical/ne_10m_lakes.zip'
    rivers:
        type: 'shp'
        path: 'http://www.naturalearthdata.com/http//www.naturalearthdata.com/download/10m/physical/ne_10m_rivers_lake_centerlines.zip'
        where: featurecla = 'River' AND scalerank < 8
    quakes:
        type: 'csv'
        path: 'data/nepal.csv'
        properties:
            - 'date'
            - '+intensity'
Mapturner currently supports SHP, JSON and CSV files.
Drawing The Map
I’ve been pretty impressed with the relative ease of using D3 to render maps and test projections. Need to adjust the scope of the map? It might just be a matter of adjusting the map scale and centroid (and, if necessary, expanding the overall bounding-box and re-running the mapturner script) — much faster than redrawing a flat map.
Label positioning is a tricky thing. So far, the best way I’ve found to deal with it is to set up an object at the top of the JS with all the nit-picky adjustments, and then checking for that when the labels are rendered.
var CITY_LABEL_ADJUSTMENTS = [];
CITY_LABEL_ADJUSTMENTS['Biratnagar'] = { 'dy': -3 };
CITY_LABEL_ADJUSTMENTS['Birganj'] = { 'dy': -3 };
CITY_LABEL_ADJUSTMENTS['Kathmandu'] = { 'text-anchor': 'end', 'dx': -4, 'dy': -4 };
CITY_LABEL_ADJUSTMENTS['Nepalganj'] = { 'text-anchor': 'end', 'dx': -4, 'dy': 12 };
CITY_LABEL_ADJUSTMENTS['Pokhara'] = { 'text-anchor': 'end', 'dx': -6 };
CITY_LABEL_ADJUSTMENTS['Kanpur'] = { 'dy': 12 };
Responsiveness makes label positioning even more of a challenge. In the Nepal example, I gave each label a class corresponding to its scalerank, and then used LESS in a media query to hide cities above a certain scalerank on smaller screens.
@media screen and (max-width: 480px) {
    .city-labels text,
    .cities path {
        &.scalerank-4,
        &.scalerank-5,
        &.scalerank-6,
        &.scalerank-7,
        &.scalerank-8 {
            display: none;
        }
    }
}
Our finished example map (or as finished as anything is at the end of a hackday):
There’s still more polishing to do — for example, the Bangladesh country label, even abbreviated, is still getting cut off. And the quake dots need more labelling and context. But it’s a reasonable start.
Drawing these maps in code has also meant revisiting our map styles — colors, typography, label and line conventions, etc. Our static map styles rely heavily on Helvetica Neue Condensed, which we don’t have as a webfont. We do have access to Gotham, which is lovely but too wide to be a universal go-to. So we may end up with a mix of Gotham and Helvetica — or something else entirely. We’ll see how it evolves.
Locator Maps And Dailygraphics
We’ve rolled sample map code into our dailygraphics rig for small embedded projects. Run fab add_map:$SLUG to get going with a new map. To process geo data, you’ll need to install mapturner (and its dependencies, GDAL and TopoJSON). Instructions are in the README.
Caveats And Next Steps
-
This process will NOT produce finished maps — and is not intended to do so. Our goal is to simplify one part of the process and get someone, say, 80 percent of the way to a basic map. It still requires craft on the part of the map-maker — research, judgement, design and polish.
-
These maps are only as good as their source data and the regional knowledge of the person making them. For example, the Natural Earth country shapefiles still include Crimea as part of Ukraine. Depending on where your newsroom stands on that, this may mean extra work to specially call out Crimea as a disputed territory.
-
When everything’s in code, it becomes a lot harder to work with vague boundaries and data that is not in geo format. I can’t just highlight and clip an area in Illustrator. We’ll have to figure out how to handle this as we go. (Any suggestions? Please leave a comment!)
-
We’ve figured out how to make smart scale bars. Next up: inset maps and pointer boxes. I’d also like to figure out how to incorporate raster topo layers.