 visuals + editorial graphics
Reading between the █████
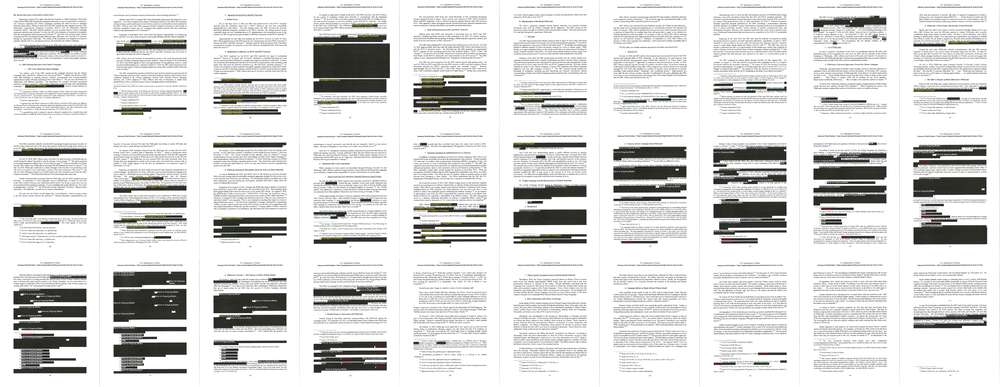
Like a lot of news organizations, when the redacted Mueller report was released, we turned to the power of small multiples to visualize it. Our story displayed all the pages in each section, letting readers see where the most material was blacked out. It's the kind of display that seems like it would be a lot of work. But in fact, it's mostly just a few simple utilities glued together with Bash scripts. Here's a quick walkthrough of our process, in case you'd like to showcase some documents the same way.
Stage 1: Generate page snapshots
Our first step is to slice the PDF file into individual page images,
which is required for all subsequent steps. The Poppler
tools are a suite of
commands for converting PDF into a variety of formats. Our first
script
creates a pages directory and then uses Poppler's pdftoppm
command to split it into numbered PNG files.
Stage 2 and 3: Create a report on the redaction color-coding
When we originally heard that the redactions in the report would be color coded, we thought it would be neat to get a count of how many pixels were used for each kind of redaction. So the second and third scripts in the repo use the versatile ImageMagick library to isolate specific colors, count each pixel, and then parse the results into a CSV for reporting.
Our assumption was that the redaction bars themselves would be colored. Unfortunately, the report used standard black bars instead, with color-coded, text labels on each bar. It would take precious time to figure out how to process this unexpected formatting, so we set aside these scripts and moved on to a more straightforward task.
Stage 4: OCR the document
We had hoped that the report would be distributed as searchable text, but we recognized that government documents are often encoded in non-machine readable formats. And sure enough, when the report was finally released, its contents were flat images, not text and shapes. We were prepared with an optical character recognition (OCR) system to do the conversion ourselves.
The open-source
Tesseract
OCR library usually works on a per-page basis, but it's possible to
pass it a text file with a list of images and have it stitch them
together into a full document. Our fourth
script
uses the Bash find and sort tools to generate a page list file,
then feeds that list to Tesseract for processing. The resulting scan
isn't perfect--in particular, the system is confused by the dotted
lines in the table of contents and some of the embedded social media
images--but the body text is clean enough to let reporters look for key
names or phrases.
Stage 5: Generate tiles
And now, the fun part: creating our per-section page
collages.
The problem isn't the tiling: ImageMagick comes to the rescue again,
with a montage command that accepts a list of images, a count of
rows or columns, and a size for each tile. The difficulty is the scale
of creating those lists of images in each section. With more than 400
pages in the report, nobody wants to feed those to ImageMagick by hand.
Instead, our script defines a makeMontage command that accepts a
start page, an end page, and an output filename. Using those, it
generates a sequence of filenames that it can pass to montage.
Adding new sections only required us to look up the page numbers (which
we were already doing for other
reporting),
and add a line to spit out a new grid.
Final thoughts
Even though there's a lot at work being done by the computer, there are only about 70 lines of code in the entire repo. A third of that is taken up by the unused JavaScript for parsing the pixel counts in stage 2. It's a testament to the value of the UNIX philosophy of development: small utilities connected together, instead of single monolithic programs.
A good rule of thumb for building data pipelines like this is to make sure that each stage generates distinct output in a file or folder, instead of doing processing in-place. Not all tasks are created equal: performing OCR is time-consuming, while parsing color counts is extremely fast. By keeping both input and output intact, it's possible to re-run only specific parts of the pipeline during development, or as requirements change.
Not every document will lend itself to the kind of visual treatment that the Mueller report received, but the component tasks detailed here–OCR, pagination, and image analysis–are extremely common in a journalism context. Moreover, as the examples show, they can serve as the visual foundation for other kinds of analysis. Please feel free to use our code as a reference, and let us know about any projects you build with it!