How we cleaned up and ranked our listeners' favorite albums of 2016
There’s a new blog post describing the 2017 process here
 All Songs Considered asks listeners for their favorite albums of 2016
At the beginning of December 2016, All Songs Considered followed a nice tradition and asked listeners for their favorite albums of 2016. Users could enter up to five different albums in a Google form, ranked according to their preferences. The poll was open for eight days and resulted in more than 4,500 entries.
In the end, the All Songs Considered team wanted a ranked list of the best albums. Sounds easy, right?
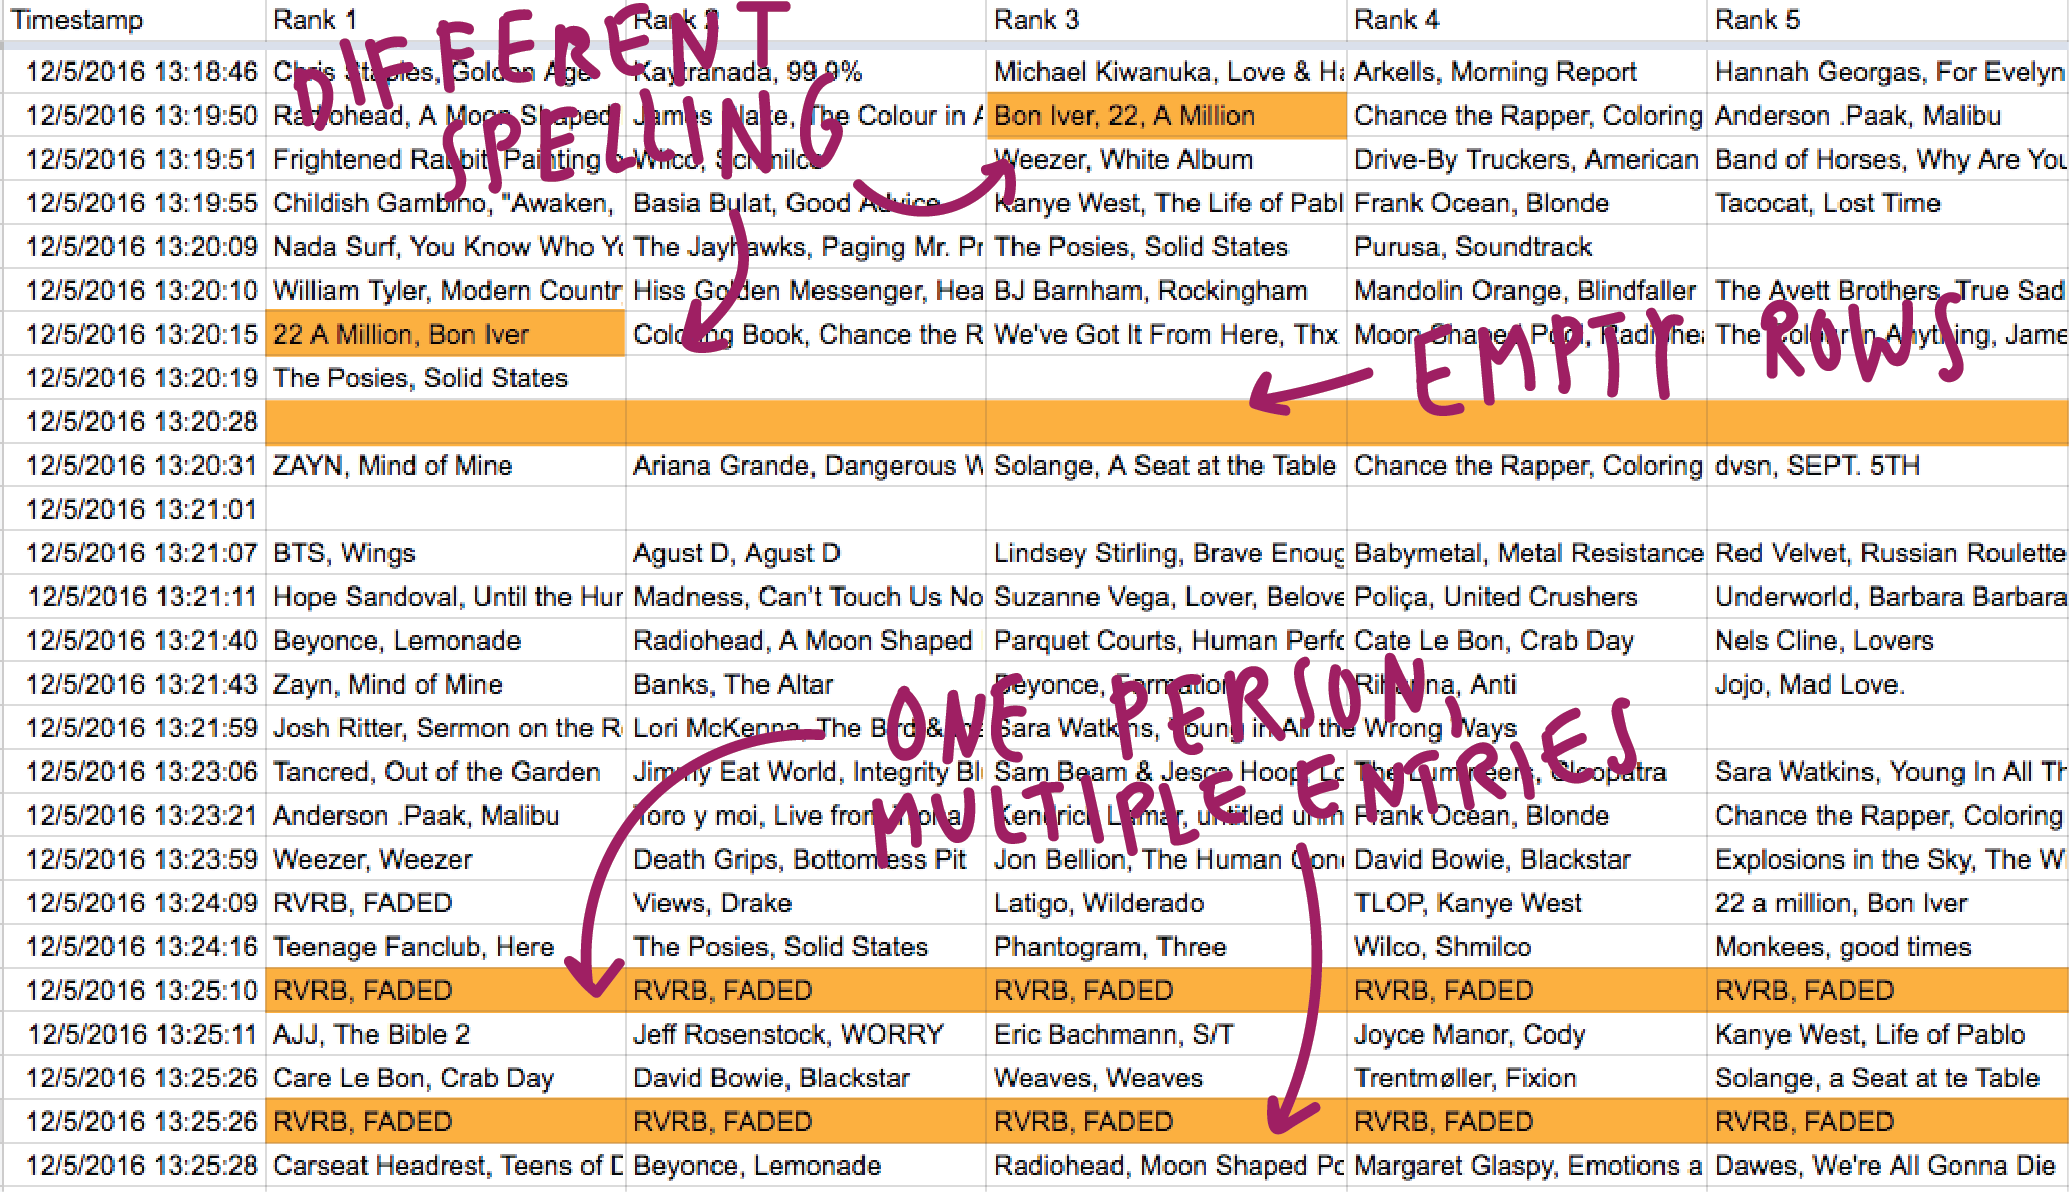
But data is always messy and there are a few problems to solve with this dataset. First, there were some obviously not-so-awesome things going on with the Google spreadsheet that gathers the results:
 Different spelling, empty rows, multiple entries by one person: Ugh
In addition to cleaning up the data to make it usable, we had to decide on a weighting algorithm for the five different ranks and calculate it.
Since the whole project had a tight deadline, our process wasn’t pretty, but we did it. Here’s how:
Step 1: Combining Like Entries
The poll asks listeners to type in the artist and album, separated with a comma. But humans are faulty creatures who make spelling mistakes, don’t obey the rules or don’t remember the name of an album correctly. This faultiness results in a nice compilation of a dozen different ways to write one and the same thing:
Bon Iver - 22, a Million
Bon Iver -22, A Million
Bon Iver 22 a million
Bon Iver, '22, A Million'
BON IVER-22 A MILLION
Bon Iver
bon iver, "22, a million"
Bon Iver, 22/10
Bon Iver, 20 a Million
Bon Iver 22
bon iver, 22 a million
Bon Iver, 22, A Million
Bon Iver, 22a million
BonIver, 22 a million
Bon Iver, 33 a million
Bon Iver, 22 million
Bon Iver,22,a Million
22, A Million
Bon Iver: 22, A million
bon iver. 22,a million
…
…and that’s still a relatively easy album name. I rely on your imagination to think of all the possible ways to spell “A Tribe Called Quest, We Got It from Here… Thank You 4 Your Service”.
To fix that mess, we used a combination of cluster analysis in OpenRefine and “Find and Replace” in Google Spreadsheet.
First, OpenRefine. To run the cluster analysis on just one column instead of five different ones, we needed to transform the data from a “wide” format into a “long” format. This can be easily achieved, e.g. with R:
library(reshape2)
d = read.csv("data.csv",stringsAsFactors = FALSE)
d = melt(d,id.vars = c('Timestamp'))
write.csv(d,”data_long.csv”)
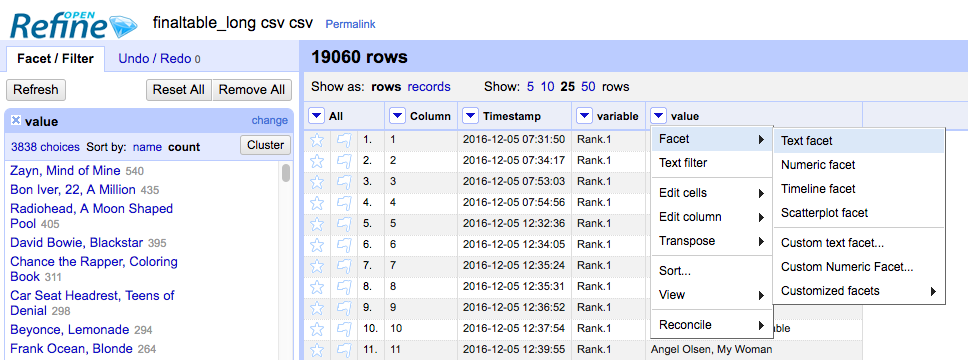
Then we imported the CSV into OpenRefine, selected our one column that states all artist-album entries and chose Facet > Text Facet and then Cluster.
 Text Facet in OpenRefine
So what is cluster analysis? Basically, OpenRefine can run different algorithms on the data to cluster similar entries. Depending on the algorithm, “similar” is defined differently. OpenRefine offers different methods and keying functions, and we used all of them one after another.
 Clustering in OpenRefine
OpenRefine then lets us select and merge similar entries and give them all a new name.
After successfully running through lots of different cluster methods, our data was approximately 95 percent clean. Our Bon Iver entries looked like this:
Bon Iver, 22, A Million
Bon Iver, 22, A Million
Bon Iver, 22, A Million
Bon Iver, 22, A Million
Bon Iver
Bon Iver, 22, A Million
Bon Iver, 22, A Million
22, A Million
Bon Iver, 22, A Million
Bon Iver, 22, A Million
…
So much better! But OpenRefine doesn’t take care of the cases in which only the album or artist is mentioned. So we imported the data back into Google Spreadsheet and took care of that by hand – with a combination of “Find and Replace” and sorting the list alphabetically (which places all the Bon Iver’s before Bon Iver, 22, A Million).
Step 2: Roughly clean up with a Python script
Once we made sure that the albums were written in the same way, they were countable. But we still needed to only count the entries that are from individual listeners who don’t abuse the poll. To do so, we ran the cleaned data through a Python script. The Pandas library is a great choice for our first easy task, dropping the empty rows:
# Drop empty rows
albums.dropna(subset=RANKS)
But Pandas proved to be a bad choice for the next task: Deleting duplicate rows that appears within one hour. Doing that makes sure that we eliminated the entries that obviously come from one and the same person. We saw dozens of these copy-and-pasted entries (especially for the album Mind of Mine by Zayn). To get rid of all the duplicate entries within one hour, we first transformed the Pandas dataframe to a Python list and then checked for identical entries:
# Do row values match? If not, not a dupe
for rank in RANKS:
    if row1[rank] != row2[rank]:
        return False
The last piece is checking for mentions of the same album within one entry, eg “Beyonce, Lemonade” on rank 1 and on rank 3. We wanted to delete these rows as well. To do so, we used a solution that we found on StackOverFlow:
# check if all elements in a list are identical
iterator = iter(iterator)
try:
    first = next(iterator)
except StopIteration:
    return True
return all(first == rest for rest in iterator)
That whole process removed 1200 empty or duplicate rows and brought the CSV from 4,500 entries down to 3,300 entries.
Step 3: Weight and rank with an R script
Wooooooohoo! We went from messy, human-made data to clean, machine-readable data! Next, we did the actual calculations that got us to a ranked list of the top albums.
To spice things up a little bit (or maybe because we have people with different favorite tools on the team), we did this part of the process not with Python, but with R.
After converting the data back into a long format, it looks like this:
 Data with ranks in long format
Next, we gave each album a ranking value. To do so, we just replaced the rank columns with ranking values:
d$rank[d$rank=="Rank.1"]= 5
d$rank[d$rank=="Rank.2"]= 4
d$rank[d$rank=="Rank.3"]= 3
d$rank[d$rank=="Rank.4"]= 2
d$rank[d$rank=="Rank.5"]= 1
Note here that we are giving the number one albums the most points and the number five album the least points. This means a sum of these points will lead to the most popular album.
With numerical rank values, we could try out different ranking methods and different ways of aggregating these ranks. We quickly found that artists like Zayn who had campaigns on their behalf had huge spikes on certain days in terms of entries:
 The table shows how often Zayn’s Mind of Mine was mentioned on all days of the poll. He was really successful on the first and the second-to-last day.
In contrast, artists like Bon Iver have a very consistent number of entries each day. We decided to favor these consistent entries. Our final calculations gave back a rank of albums for each day and then summed these daily rankings.
To do so, we reduced the Timestamp column to the month and day with d$Timestamp = substr(d$Timestamp,1,5), which removes all characters after the first 5 characters. Then we used the dplyr library to sum up the rankings to calculate points for each album on each day:
d = d %>%
  group_by(Timestamp,album) %>%
  summarise(points = sum(rank))
After getting rid of the n/a values, we sorted the albums by these points and give it a rank number. Meaning, the album with the most points per day gets the rank “1”, the album with the second most points per day gets the rank “2” etc:
d = d %>%
  arrange(Timestamp, -points, album) %>%
  group_by(Timestamp) %>%
  mutate(rank=row_number())
After transforming the data back to a wide format and summing up the ranking for each day, we arrive at the final ranking:
 The final ranking: the sum of the rankings for each day.
For days where an album did not get mentioned, we used the ranking 200. We achieved this with d_wide[is.na(d_wide)] <- 200:
 We replaced empty values with a high number, so that they didn’t show up at the top of the ranking
If we wanted to be more correct, we could get the max number of mentioned albums for each day, and then replace the n/a values with this max number. Since we only want to show the very top albums and they were all mentioned at least once every day, we didn’t need that method for our goal.
We made it! To recap this complicated process, let’s look at the steps again:
- To unify the spelling of these albums, we ran some cluster analysis in OpenRefine and cleaned up the data in Google spreadsheet
- Then we wrote a Python script to remove duplicate rows/cells and empty rows
- At the end, we calculated the ranking for each album per day and summed them up with an R script
The final ranking is also published on All Songs Considered. Next time we’ll do an autocomplete survey, yeah?
 visuals + editorial graphics

