Creating And Deploying Small-Scale Projects
In addition to big, long-term projects, the NPR Visuals team also produces short-turnaround charts and tables for daily stories. Our dailygraphics rig, newly open-sourced, offers a workflow and some automated machinery for creating, deploying and embedding these mini-projects, including:
- Version control (with GitHub)
- Starter code for frequently-reused project types (like bar charts and data tables)
- One command to deploy to Amazon S3
- A mini-CMS for each project (with Google Spreadsheets)
- Management of binary assets (like photos or audio files) outside of GitHub
Credit goes to Jeremy Bowers, Tyler Fisher and Christopher Groskopf for developing this system.
Two Repos
This system relies on two GitHub repositories:
- dailygraphics, the “machine” that creates and deploys mini-projects
- A private repo to store all the actual projects (which we’re calling graphics)
(Setting things up this way means we can share the machinery while keeping NPR-copyrighted or embargoed content to ourselves.)
Tell dailygraphics where the graphics live (relative to itself) in dailygraphics/app_config.py:
# Path to the folder containing the graphics
GRAPHICS_PATH = os.path.abspath('../graphics')
When working on these projects, I’ll keep three tabs open in Terminal:
- Tab 1: dailygraphics, running in a virtualenv, to create graphics, update copy, sync assets and deploy files
- Tab 2: dailygraphics local webserver, running in a virtual environment, to preview my graphics as I’m building them (start it up using
fab app) - Tab 3: graphics, to commit the code in my graphics to GitHub
If you use iTerm2 as your terminal client, here’s an AppleScript shortcut to launch all your terminal windows at once.
Create A Graphic
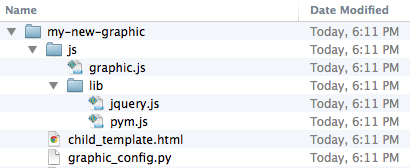
In Tab 1, run a fabric command — fab add_graphic:my-new-graphic — to copy a starter set of files to a folder inside the graphics repo called my-new-graphic.

The key files to edit are child_template.html and, if relevant, js/graphic.js. Store any additional JavaScript libraries (for example, D3 or Modernizr), in js/lib.
If you’ve specified a Google Spreadsheet ID in graphic_config.py (our templates have this by default), this process will also clone a Google Spreadsheet for you to use as a mini-CMS for this project. (More on this later.)
I can preview the new project locally by pulling up http://localhost:8000/graphics/my-new-graphic/ in a browser.
When I’m ready to save my work to GitHub, I’ll switch over to Tab 3 to commit it to the graphics repo.
Publish A Graphic
First, make sure the latest code has been committed and pushed to the graphics GitHub repo (Tab 3).
Then return to dailygraphics (Tab 1) to deploy, running the fabric command fab production deploy:my-new-graphic. This process will gzip the files, flatten any dynamic tags on child_template.html (more on that later) into a new file called child.html and publish everything out to Amazon S3.
Embed A Graphic
To avoid CSS and JavaScript conflicts, we’ve found that it’s a good practice to keep our code-driven graphics walled off to some degree from CMS-generated pages. Our solution: embed these graphics using iframes, and use Pym.js to keep the iframes’ width and height in sync with their content.)
- The page where I preview my graphic locally —
http://localhost:8000/graphics/my-new-graphic/— also generates “parent” embed code I can paste into our CMS. For example:
- The
js/graphic.jsfile generated for every new graphic includes standard “child” code needed for the graphic to communicate with its “parent” iframe. (For more advanced code and examples, read the docs.)
Connecting To A Google Spreadsheet
Sometimes it’s useful to store information related to a particular graphic, such as data or supporting text, in a Google Spreadsheet. dailygraphics uses copytext, a Python library that serves as an intermediary between Google Spreadsheets and an HTML page.
Every graphic generated by dailygraphics includes the file graphic_config.py. If you don’t want to use the default sheet, you can replace the value of COPY_GOOGLE_DOC_KEY with the ID for another sheet.
There are two ways I can pull down the latest copy of the spreadsheet:
-
Append
?refresh=1to the graphic URL (for example,http://localhost:8000/graphics/my-test-graphic/?refresh=1) to reload the graphic every time I refresh the browser window. (This only works in local development.) -
In Tab 1 of my terminal, run
fab update_copy:my-new-graphicto pull down the latest copy of the spreadsheet.
I can use Jinja tags to reference the spreadsheet content on the actual page. For example:
<header>
    <h1>{{ COPY.content.header_title }}</h1>
    <h2>{{ COPY.content.lorem_ipsum }}</h2>
</header>

<dl>
    {% for row in COPY.example_list %}
    <dt>{{ row.term }}</dt><dd>{{ row.definition }}</dd>
    {% endfor %}
</dl>
You can also use it to, say, output the content of a data spreadsheet into a table or JSON object.
(For more on how to use copytext, read the docs.)
When I publish out the graphic, the deploy script will flatten the Google Spreadsheet content on child_template.html into a new file, child.html.
(Note: A published graphic will not automatically reflect edits to its Google Spreadsheet. The graphic must be republished for any changes to appear in the published version.)
Storing Larger Assets
One of our NPR Visuals mantras is Don’t store binaries in the repo! And when that repo is a quickly multiplying series of mini-projects, that becomes even more relevant.
We store larger files (such as photos or audio) separate from the graphics, with a process to upload them directly to Amazon S3 and sync them between users.
When I create a new project with fab add_graphic:my-new-graphic, the new project folder includes an assets folder. After saving media files to this folder, I can, in Tab 1 of my Terminal (dailygraphics), run fab assets.sync:my-new-graphic to sync my local assets folder with what’s already on S3. None of these files will go to GitHub.
This is explained in greater detail in the README.
In Sum
Our dailygraphics rig offers a fairly lightweight system for developing and deploying small chunks of code-based content, with some useful extras like support for Google Spreadsheets and responsive iframes. We’re sharing it in the hope that it might be useful for those who need something to collect and deploy small projects, but don’t need something as robust as our full app-template.
If you end up using it or taking inspiration from it, let us know!
(This was updated in August 2014, January 2015 and April 2015 to reflect changes to dailygraphics.)
 visuals + editorial graphics

